Variance, spread and why streaks are ordinary
Expected value locates the centre of a distribution and variance describes the spread. How the two grow apart with trials, and why long runs are routine.
Two numbers, not one
A game is described by at least two figures. The first is its expected value, the average result per trial. The second is its spread, the typical distance of an individual result from that average. Reports of gambling results usually quote only the first, which is why the second so often looks like evidence that the first is wrong.
Working the spread of one trial
Take an even-money bet on a thirty-seven-pocket wheel: one unit staked, returning +1 with probability 18/37 and −1 with probability 19/37. Because every outcome is +1 or −1, every squared outcome is 1, and the variance is almost exactly 1.
mean            = (18/37)(+1) + (19/37)(-1)  =  -0.027027
mean of X^2     = (18/37)(1)  + (19/37)(1)   =   1.000000
variance        = 1.000000 - (-0.027027)^2   =   0.999270   per trial
standard dev.   = sqrt(0.999270)             =   0.999635 units
How the two grow apart
Over n independent trials the expected result multiplies by n; the standard deviation multiplies by the square root of n. One grows in a straight line and the other along a curve that flattens, so the ratio between them rises without limit. That divergence is the entire content of the phrase "the long run".
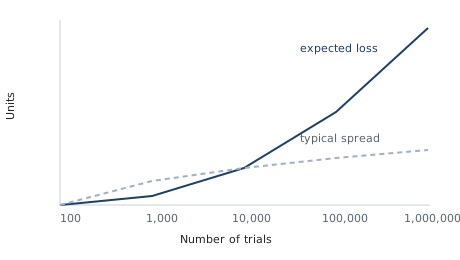
trials       expected result      typical spread     ratio
    100          -2.70 units          10.00 units      0.27
  1,000         -27.03 units          31.61 units      0.86
 10,000        -270.27 units         100.00 units      2.70
100,000      -2,702.70 units         316.23 units      8.55
At a hundred trials the spread swamps the expectation and finishing ahead is unremarkable. At a thousand they are comparable. At ten thousand the expected loss is 2.70 standard deviations below zero, and by a hundred thousand it is 8.55 below, at which point finishing ahead is not a realistic outcome. Nothing about the game changes across those rows. The only variable is how many times it has been played.
Streaks are ordinary
A run of identical results looks like a departure from randomness and is a straightforward consequence of it. The probability of ten consecutive results from an eighteen-in-thirty-seven group is the tenth power of that proportion, which is small for any particular ten trials and unremarkable across many.
P(one such result)   = 18/37       = 0.486486
P(ten in a row)      = 0.486486^10 = 0.00074251

                     = about 1 in 1,347 ten-trial windows

Across 10,000 consecutive trials there are 9,991
overlapping windows of ten, so the expected count of
ten-in-a-row runs is

  9,991 x 0.00074251  =  7.4 runs
So a run of ten will appear roughly seven times in ten thousand trials as a matter of routine. Its appearance is not a signal, it does not indicate that a mechanism is behaving unusually, and it carries no information about what follows. A sequence that contained no such runs would be the anomaly.
Volatility as a design choice
Spread is not an accident of a game either; it is specified. Two games can return the same proportion of amounts staked while differing enormously in how that return is delivered, one paying small amounts often and the other paying large amounts rarely. That choice is what volatility means, and it is set in the prize schedule independently of the return. Its practical effect is on how long results take to resemble the expectation: high volatility lengthens the stretch over which almost anything can happen, without altering where the arithmetic points.